Delivering mobile-ready infographics
Uva is an internal platform for replacing static JPG images with easy-to-embed & responsive graphics
Overview
I pitched, designed, developed the UI of Uva, an in-house tool for delivering great visual journalism for readers.
Before that, the few charts and information graphics that got published on Estadão, a major Brazilian newspaper, were JPG images that were hard to read on a smartphone.
In other words, the “print-first” graphics team was producing dozens of graphics daily, but for print. The few that got published online were often too small (imagine a fitting a 4-column infographic into an old iPhone screen).
With that in mind, I gathered my “digital-first” graphics team and we started exploring solutions, thinking about the experience from 3 different points of view:
- Subscribers & readers
- “Print-first” graphic designers
- My “digital-first” dataviz team
We decided to use an open source script for Adobe Illustrator, created by the The New York Times, called ai2html. It basically “converts” information graphics from Illustrator to HTML, for better accessibility and responsiveness.
The idea was that the graphic designers could draw different versions of the same chart, with a clear mapping between column-based print layouts and web-based screen sizes. We made print & digital interchangeable.
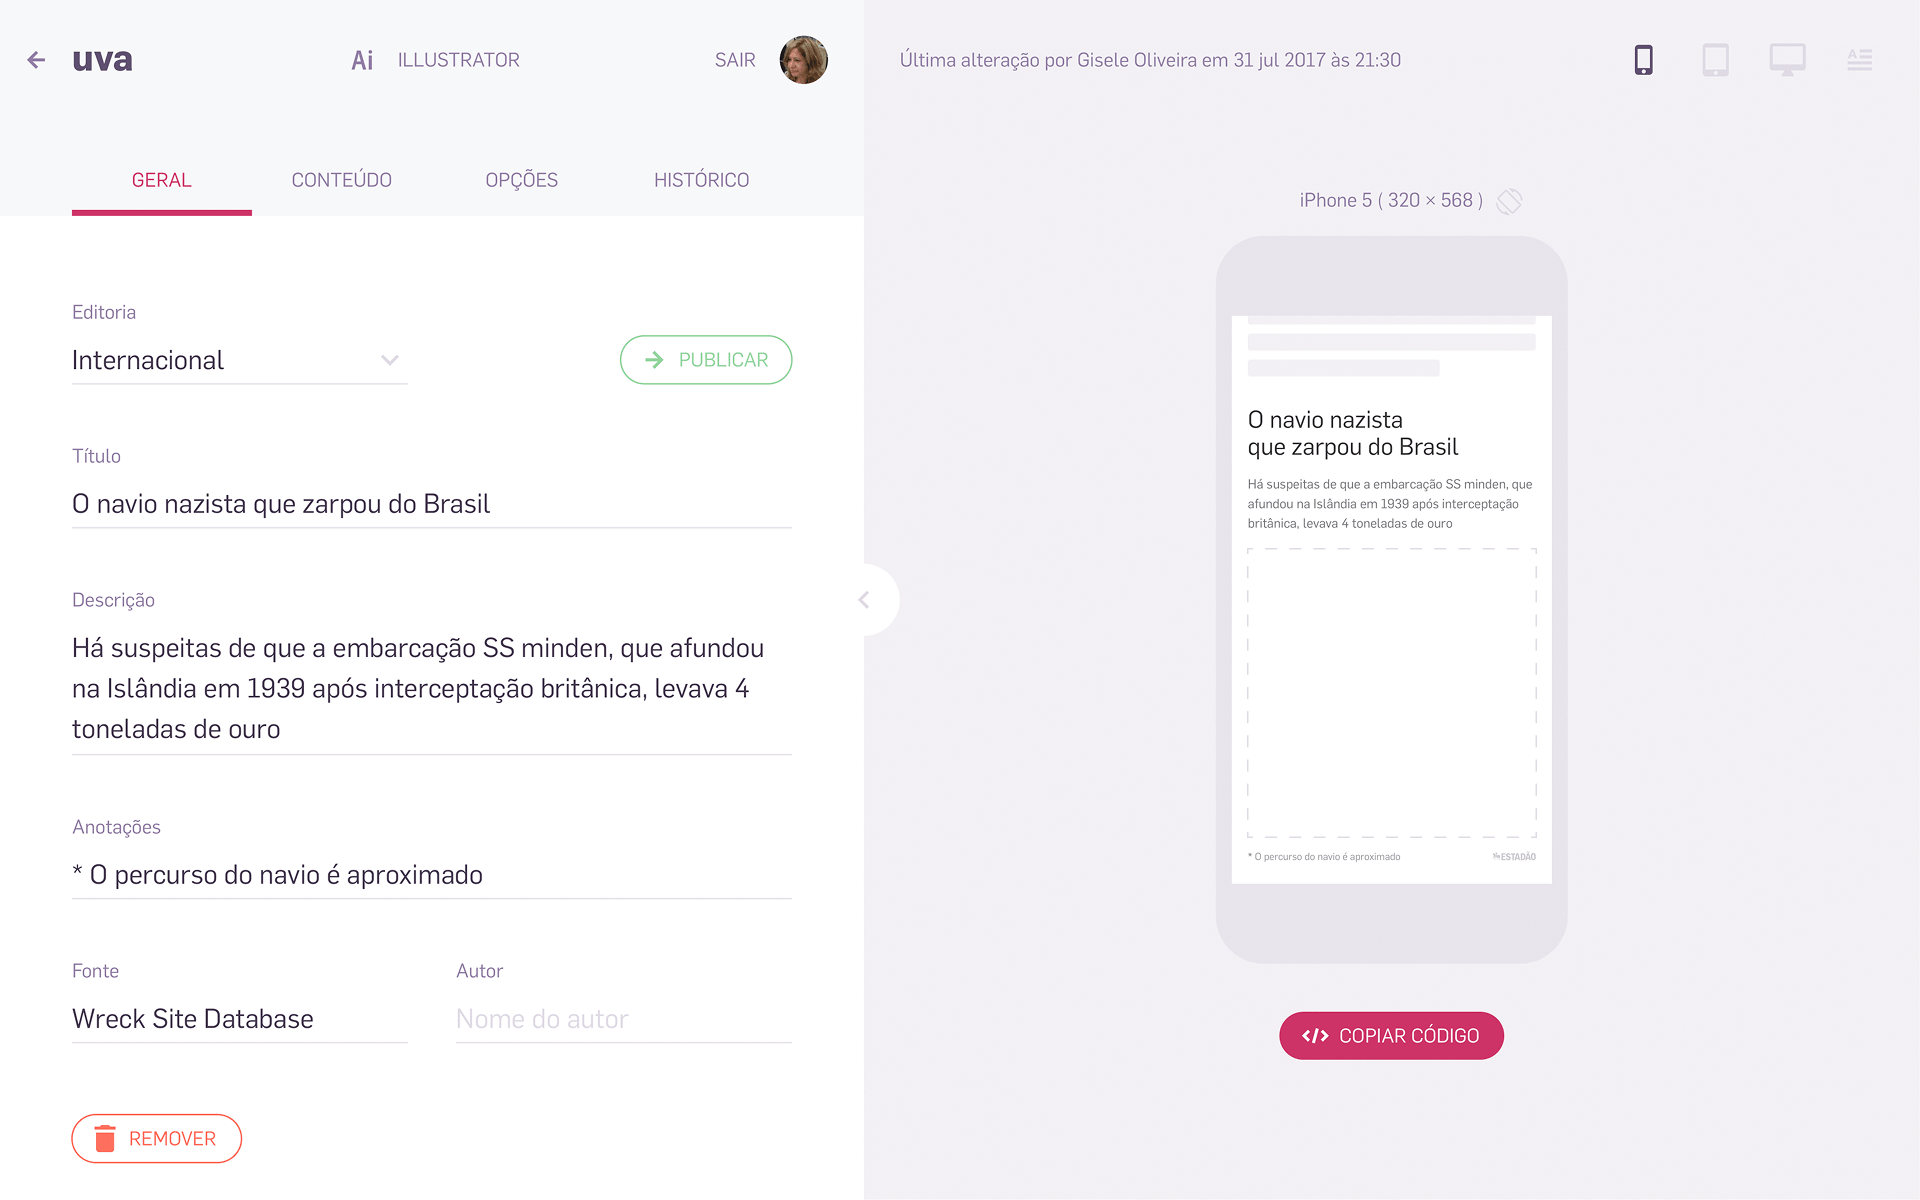
After a round of feeedback, we designed the MVP of the platform, that would allow graphic designers to upload custom charts — drawn to fit up to four screen sizes — and embed them inside articles.

As you can see on the purple side bar above, the roadmap for Uva included many features (like automated charts), but let’s focus on the responsive Illustrator charts here.
We presented the project to my executive director and editor – and they were on board. Let’s get into it 👇

Outcomes
We started developing it from scratch, using a one week sprint workflow. The prioritization and backlog methods were all Scrum-inspired. After two months, we launched it.
In less than two years after that, all the graphics published through Uva were viewed by more than 30 million users.

It was a win for readers, who could better understand the facts through visual explanations.
It was a win for the “print-first” designers, who were losing space inside the company. Now they were creating & publishing mobile-ready infographics in minutes, daily.
It was also a win for my team. We could now focus our efforts on more ambitious projects, like experimental data-driven narratives & advanced visualizations.
My Role
- Pitch & Ideation
- UX/UI Design
- Front End Development
Uva was created in close collaboration with Carlos Marin, who worked his magic on the Illustrator script, our servers, and all back end logic.